Pavlović BI
How it works · Client work · About · Book a call

Balance Sheet | Year over Year

Three years of balance sheet side by side, with the change against last year in dollars and percent, and two charts showing which sections moved. Built on a dealership’s chart of accounts, including contracts in transit and floor plan.
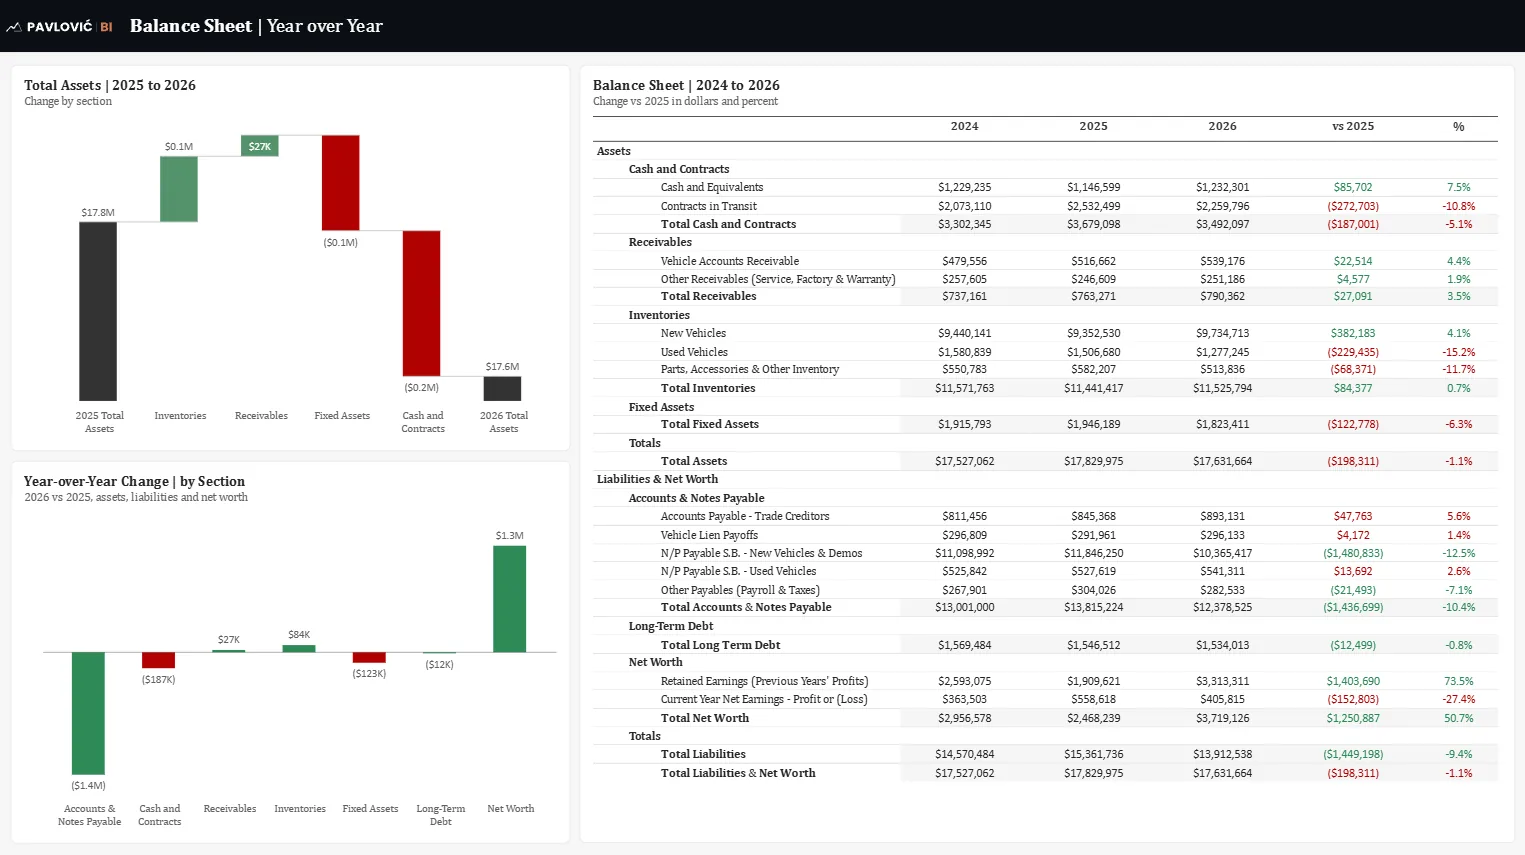
Screenshot of the Balance Sheet | Year over Year Power BI report: Three years of balance sheet side by side, with the change against last year in dollars and percent, and two charts showing which sections moved.
  • Back to portfolio