Pavlović BI
How it works
·
Client work
·
About
·
Book a call
Client work
Power BI reports built the way I build them for clients, with sample data and real structure.
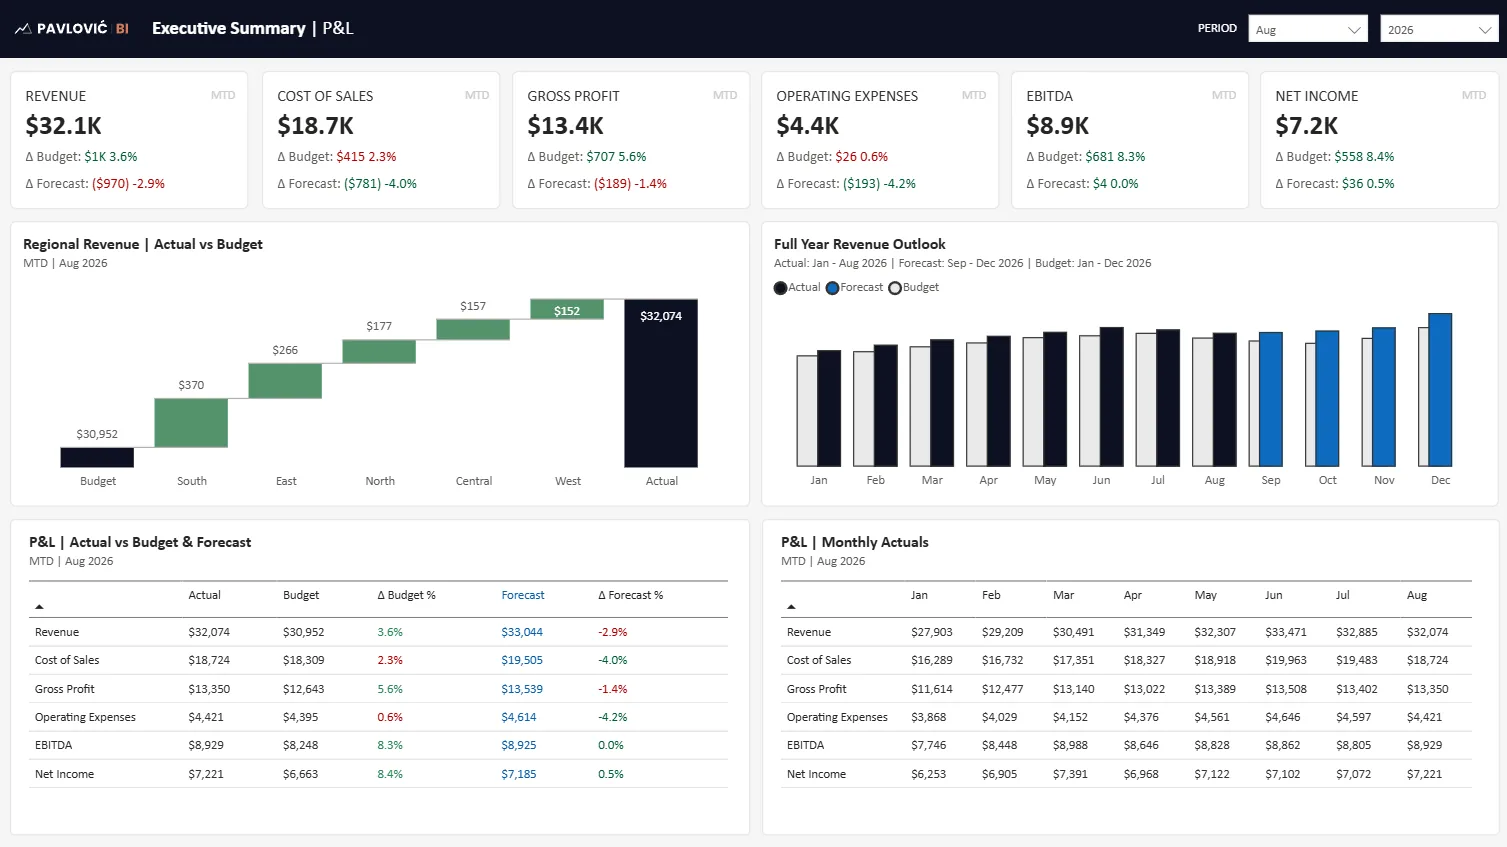
Executive Summary | P&L
Executive Summary | Sales Performance
Revenue | vs Last Year
Products | Pareto, Winners & Losers
Customers | Segmentation
P&L | Monthly vs Prior Year
Balance Sheet | Year over Year
P&L | Actual & Forecast
P&L | Actual vs Budget
HubSpot to Power BI