P&L | Monthly vs Prior Year
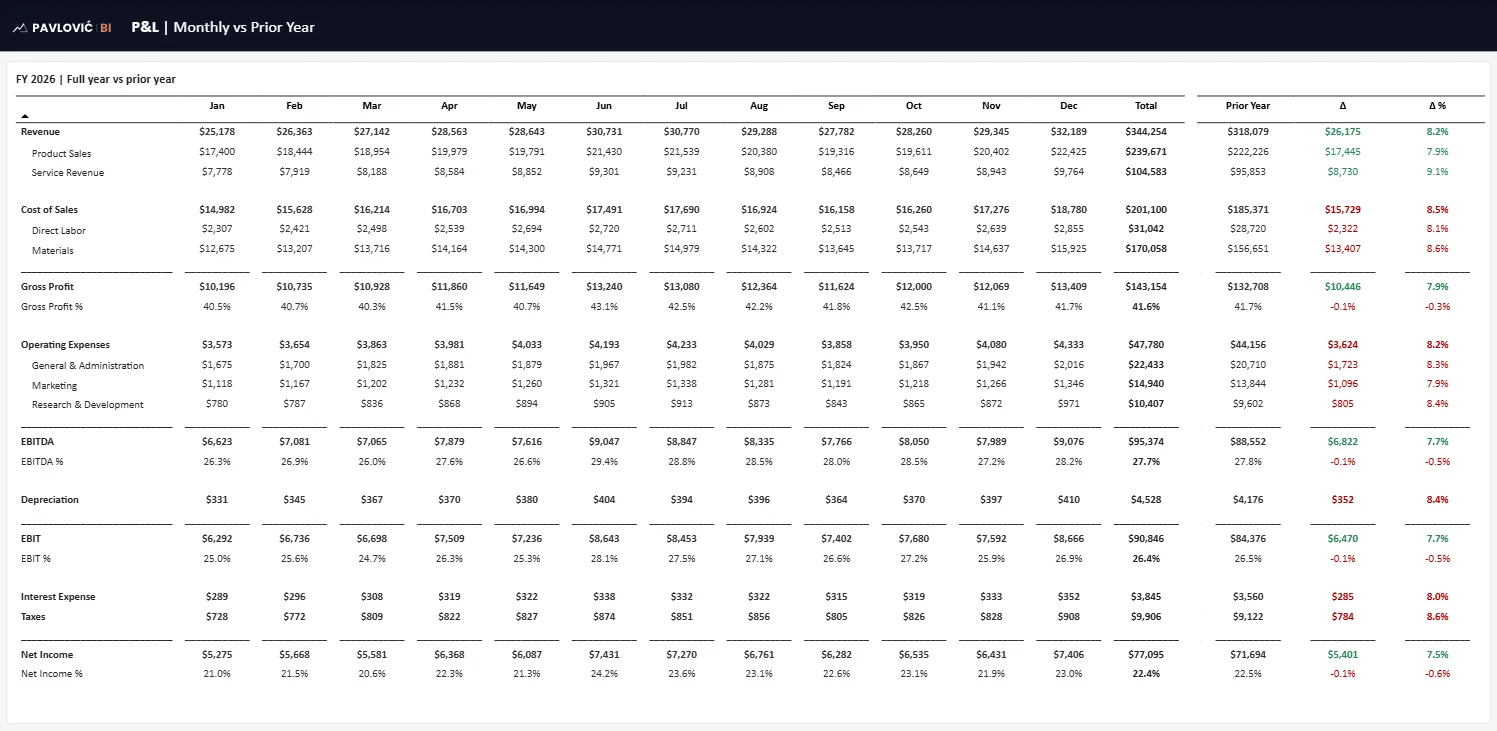
The full P&L month by month, with the full year next to the prior year and the change in dollars and percent. Variances are colored by impact, so rising costs show red.
The full P&L month by month, with the full year next to the prior year and the change in dollars and percent. Variances are colored by impact, so rising costs show red.