Products | Pareto, Winners & Losers
A Pareto chart showing that 11 of 18 SKUs make up 80% of revenue, the biggest gains and losses against the prior period, and a ranked detail table for every SKU.
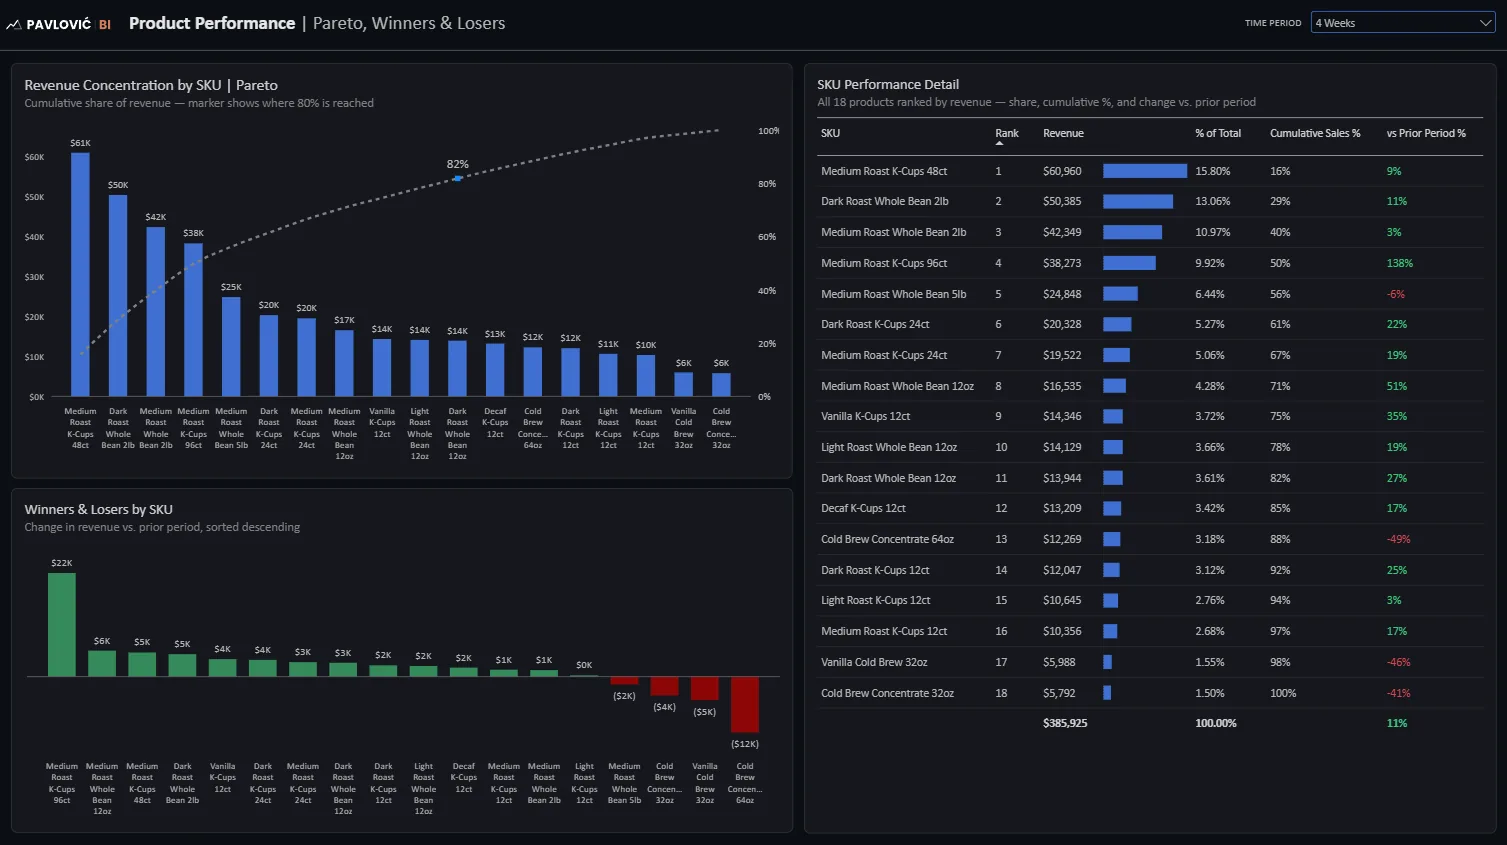
A Pareto chart showing that 11 of 18 SKUs make up 80% of revenue, the biggest gains and losses against the prior period, and a ranked detail table for every SKU.